| |
Nevron Gauge for SQL Server Reporting Services (SSRS) is an advanced report item that delivers a complete set of gauge types, highly customizable axes, tight data integration, and unmatched visual effects to your reports. It improves your report authoring experience with its polished visual editors, refined settings, and well-organized structure.
Nevron Gauge for SSRS is a must-have tool for any advanced Business Intelligence, Scorecard, Presentation, Scientific, or general-purpose report. Whether you are looking to display complex KPIs or enhance existing reports with advanced gauges, state indicators, and numeric displays, Nevron Gauge for SSRS can help you achieve your goals quickly and easily.
Nevron Gauge for SSRS features: Radial and Linear Gauges, Numeric Displays and State Indicators Combinations of Multiple Gauges Advanced Gauge Axes and Scales Configuration Unmatched Visual Styling Built-in gauge formulas for data analysis Seamless integration with SQL Server Reporting Services
Major Features Support for Multiple Gauge Areas - unlimited number of gauge areas are supported. Each gauge area has its own gauge type. Gauge areas can be automatically or manually arranged. Gauge areas can be nested into one another to create sub gauges. Support for Multiple Titles - unlimited number of titles are supported. Titles can be manually positioned or docked to gauge, gauge areas and gauge plot areas.
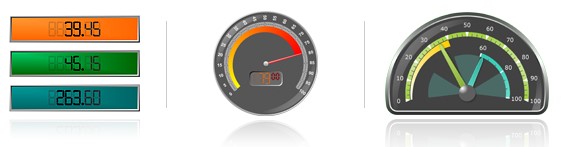
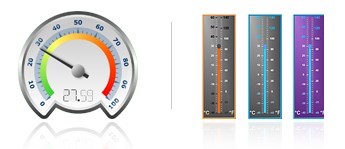
Gauge Types - a gauge type is assigned to each gauge area. Supported are the following gauge types:
Radial - displays axes, ranges and pointers in a circular fashion.
Subtypes: Radial, Quarter North East, Quarter North West, Quarter South West, Quarter South East, Half North, Half South, Half West, Half East and Custom. When using Custom subtype the user can specify custom begin angle, sweep angle, border style etc. Linear - displays axes, ranges and pointers in a linear fashion.
Subtypes: Horizontal and Vertical. Numeric Display - displays a value in a fashion similar to a LED display.
Display Styles: Seven Segment Normal, Seven Segment Rounded, Seven Segment Rectangular, Fourteen Segment Normal, Fourteen Segment Rectangular, Fourteen SegmentInset, Matrix Rectangle and Matrix Circle. State Indicator - supplementary gauges, typically used to visually prompt the user that a value has entered a critical range.
Axes - radial and linear gauge types support an unlimited number of axes, packed with a complete set of features designed to solve even the most complex gauge requirements. Features include: Ranges - radial and linear gauge types support an unlimited number of ranges. Ranges help you visualize the coverage of a values range on a certain axis. Features include:
Pointers - radial and linear gauge types support an unlimited number of pointers. Pointers help you visualize a value on a certain axis. Radial gauges support numerous needle styles. Both linear and radial gauges can display pointers as markers.
Gauge Formulas - gauges are designed to provide data analysis to sets of numeric values. Gauge formulas can be applied to the aggregated sets applicable to axis ranges {min and max}, ranges {begin and end} and pointer and numeric display values. Supported are the following gauge formulas:
Min - finds the min value from a set. Max - finds the max value from a set. Average - finds the average value from a set. Median - finds the value that splits the set in half (e.g. half of the values are smaller than median value and half are larger). First - gets the first value from a set. Last - gets the last value from a set. Sum - gets the sum of all values in the set Count - gets the count of the values in the set Percentile - finds the value that splits the set in a custom percent. Variance - the variance is used to measure the tendency of the values in the set to deviate from the average. Standard Deviation - Returns the standard deviation of the values in the set.
Rendering Support for different image formats Specify resolution Image sizing options Gray scale rendering On/off image map rendering Control over text and shape anti-aliasing Control over the currently used culture settings. You can select a custom culture or synchronize the currently used culture with the user regional settings. Ability to measure and display time required by the server to generate and display the gauge. This feature allows you to profile your reports.
Appearance Customizations Fill Style editor - helps you define the filling of an element. Provides options for solid color, gradient, image and advanced gradient fill types. Stroke Style editor - helps you define the outline/stroke of an element. Provides options for line caps and joins, line pattern and color. Shadow Style editor - helps you define the shadow which is cast by an element. Provides options for solid, linear, radial blur and Gaussian blur shadows. Text Style editor - helps you define the default appearance of a text element. Provides options for font size and type, font filling, outline, shadow, backplane etc. Frame Style editor - helps you define the frame of the component and its panels. Supports artistic/image borders.
Code Embedding Allows you to modify every aspect of the gauge appearance using C# code.
Templates
Allows you to save and load the component state inside the report designer
|