|
The new generation of Chart FX 8 products are smarter than ever! With emphasis on data analytics, Chart FX 8 brings your web and desktop applications to a whole new level. Read more on this exciting new release from the leading data visualization and business intelligence tool for developers or download your trial today!
Chart FX 8 works with Visual Studio 2010, 2012, 2013, 2015+. However, if you’re working with any .NET Framework 2.0 and above, Chart FX 8 is compatible with them.
What’s bubbling new on Chart FX 8? Easy chart integration to your MVC applications! Since there is no design view or forms in MVC, you can't just drag and drop the chart where you want it displayed, making it difficult and cumbersome to integrate charts in your MVC projects. The optional Chart FX 8 MVC library contains a few methods that when called at the right place will include all the styles, scripts and routes necessary. All automatically and with minimal input from the developer. And there is no compromise, all Chart FX 8 features and extensions are available just as they are outside of the MVC environment. 
Statistical Extensions Included!
That's Right! The Chart FX 8 Statistical Extension allows developers to integrate statistical functionality with a wide variety of pre-defined studies, study groups, calculations and testing algorithms with minimal programming effort. In addition the Chart FX 8 Statistical Extension also introduces a new set of supported gallery types, including but not limited to BoxPlot, Histogram, FrequencyPolygon, Ogive and Regression charts.
Financial Extension also Added! With an impressive array of price and technical indicators, and even interactive drawing features Chart FX 8 introduces a well-organized sidebar from where to access indicators such as Bollinger Bands, Moving Averages and Volume. In addition, Kagi, Point and Figure, Renko, and Three Line Break charts are provided as additional chart galleries. You can even customize and add your own technical indicators using Chart FX 8 powerful and intuitive API. 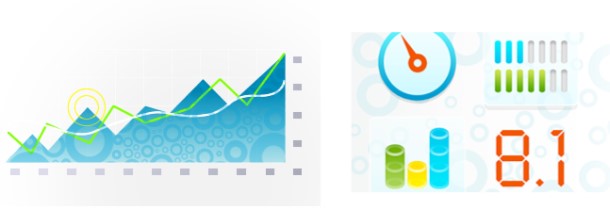
Gauges Now Included!
With the latest Chart FX 8 Service Pack release, Chart FX 8 now includes a collection of gauge components to expand your data visualization and business analysis options. Along with several bug fixes and enhancements, the latest Chart FX 8 Service Pack now includes radial gauges, horizontal and vertical linear gauges and digital panels, allowing developers to easily create digital dashboards with the same productivity, consistency and reliability found in Chart FX.
Data Analysis With an impressive array of price and technical indicators, and even interactive drawing features Chart FX 8 introduces a well-organized sidebar from where to access indicators such as Bollinger Bands, Moving Averages and Volume. In addition, Kagi, Point and Figure, Renko, and Three Line Break charts are provided as additional chart galleries. You can even customize and add your own technical indicators using Chart FX 8 powerful and intuitive API.
|