| |
Next Unicorn Ideal for pre-revenue startups Current version only 2 developers Dream to become Unicorn 1 hour of support | Website Great for a simple website
Upgrades: 3 months
1 developer No user authentication 2 hours of support | Internal Designed for internal applications Upgrades: 1 year
1 developer Internal user authentication 2 hours of support | SaaS Annual/Perpetual Web/Mobile Upgrades: 1 year 10 developers Int. & Ext. user authentication 2 hours of support |
|
|
Enterprise : Internal projects in large companies
OEM : Re-distributable and on-premise
AnyGantt is an advanced JavaScript based data-visualization solution, allowing everyone to utilize power of animation and ultimate interactivity. AnyGantt is an ideal tool for building complex and informative Gantt charts. 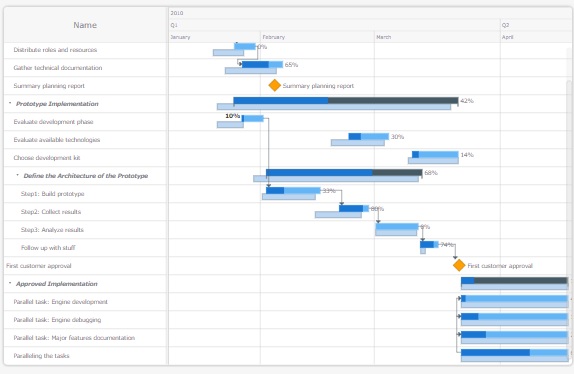
AnyGantt is fully cross-browser and cross-platform. It can be used with ASP.NET, ASP, PHP, JSP, ColdFusion, Ruby on Rails or simple HTML pages. With AnyGantt you can visualize data from any warehouse: from files in text, Excel, CSV formats to MySQL, MS SQL, and Oracle database servers.
You can use server or desktop platform of your choice to create your application - AnyGantt solution will take care of charting. Right visualization helps you to turn your data into Right Decisions! If you need advanced, award winning Gantt diagrams, then AnyGantt is the perfect solution for you.
Why AnyChart? Works all around the world: on all devices and browsers - Anychart 7 works on Windows PCs, Apple Macs, iPhones, iPads, Android devices, our JavaScript charts work everywhere, including IE 6. Easy to Use - AnyChart charts can be configured manually or automated using server side scripts. Driven by the state of the art Java Script API - Anychart JavaScript API offers you a variety of options, everything in AnyChart is customizable and can be changed (JS API, XML or JSON). Compatible with virtually all scripting languages (ASP, PHP, ColdFusion, Perl, etc.) - Use any language you like to create data source and pass it to a JavaScript code on your page, or simply use an XML/CSV/JSON file from your server. No installation - your server does not need to render any image, there is no need for any Active-X or servlet, all graphing happens on the client side. 99% of Internet-users use JavaScript enabled browsers. Constantly growing number of supported chart types - Pie, Bar, Line, Candlestick, Area, Column, Spline, Dot/Marker, Scatter, Doughnut and we are be adding new types regularly.
Major Features Support Both Project and Resource Charts
AnyGantt allows you to visualize both Project (Task based), and Schedule (Resource based) charts. Whatever chart type is used you can use all features of configurable Timeline, Datagrid and so on.
Nicely Designed Defaults
Style Based Visualization allows developers to segregate functional part from design part and focus on the business logics. Nicely designed defaults allow to keep design tasks away at all!
Advanced Text Formatting
For all text based elements, such as labels, tooltips or data-grid columns AnyGantt features powerful formatting options.
Rich Data Grid Control
Data Grid that holds basic task or resource information is highly configurable. You can add any number of custom columns that can contain additional task or resource data. Each column can have custom text formatting, height and text style settings. Data grid itself can be redesigned to reflect important data specifics.
Rich Visual Settings
Each element of AnyChart Gantt charts can be configured in its own way with a help of the flexible design system.
Any Platform can be Used
AnyGantt is a JavaScript based component, which can be used in any Web project. It doesn't depend on any server-side platform, all you need is JavaScript enabled browser on client-side.
|