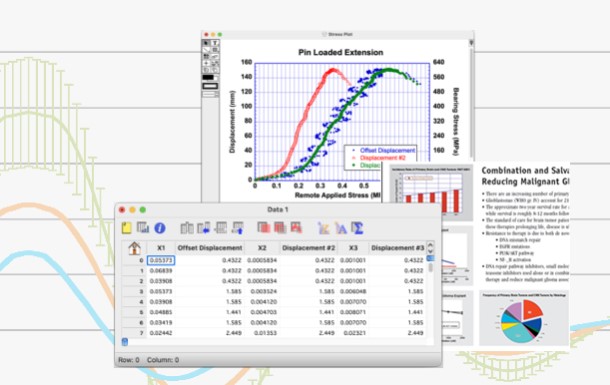
KaleidaGraph is a thoughtfully designed graphing and data analysis application for research scientists, as well as for those in business and engineering fields. Discover how user-friendly KaleidaGraph is, and how it can meet your graphing needs by trying it with your own data.

Visualize your data
Open Excel files directly or import data from a text file, with the ability to specify the structure of the text file. Display your data using one of over 25 plot types, including a variety of Line, Bar, and Statistical plots.
Explore, analyze, and learn from your results
Use KaleidaGraph’s powerful nonlinear curve fitting to define and fit your own equation, apply one of our Least Squares fits, or use one of our smoothing fits to help improve the display of your data. Add error bars in almost any way imaginable.
Communicate your findings, clearly and convincingly
Customize virtually every aspect of the plot, including the axes, ticks, grids, labels, markers, lines, and colors. Place multiple plots on a single page using our Layout window. Easily export plots or layouts by copying and pasting, or export in a variety of high resolution formats.
System Requirements
- Mac version: Mac OS 10.14 (Mojave) or later. Includes support for the M1-M3 chips.
- Windows version: 64-bit version of Windows 10 or later.
- 150 MB of free hard disk space.

